
Chapter 1
- Background to the Project1.1 Introduction
Kite traction is now a multimillion-dollar international business. With the recent advent of efficient, controllable kites the sport of kitesurfing was invented and is now booming.
As with any equipment orientated sport, the consumer demands ever-increasing performance out of new season’s gear and is willing to pay many thousands of dollars for competitive kites. But which kite is a better kite and why?
To answer the performance side of this question, Canterbury University in conjunction with Peter Lynn Kites designed and built a roof rack mounted test rig for tow testing of traction kites.
This project aims to determine the level of accuracy and repeatability of this rig in determining a kite’s lift to drag ratio and pressure coefficients as a function of wind speed and kite set. The design of the rig, methods of calibration and testing procedure will all be investigated in order to improve the quality of results.
Testing of various styles of kite will be carried out and compared with sailor’s comments in order to figure out which quantities make a superior kite.
Figure 1.1 Kitesurfing in the tropics
1.2 History of The Kite Rig
In 1998 a joint project between Peter Lynn Kites and Canterbury University set out to build a car mounted test rig for the quantification of traction kite performance. The project, taken on by Justin Stevenson and supervised by Dr Keith Alexander resulted in a fully functioning test rig, A-D board and capture software.
This rig is shown in Figure 1.2
This rig was used to gain data on traction kites over the summer of 1999-2000.
During 2000, Justin Stevenson and Andrew Reid, again supervised by Keith Alexander, undertook the redesign of the rig. Shown in figure 1.3, this redesigned rig was of simpler design in an attempt to reduce measurement errors. The new rig was used and modified throughout the year in order to further reduce measurement errors.
1.3 The First Test Rig.
Designed and built by Justin Stevenson, this rig was based around a forward pivot that allowed the rig to align itself with the pull of the kite and hence the apparent wind direction. The kite was flown on 6m lines that were spaced out appropriately on the mounting arms of the rig. Potentiometers and load cells measured angles of all lines and averaged front and back line loads.
To test a kite the car was driven to the test site and potentiometers, load cells and control lines were attached and connected up to the laptop. The potentiometers and windvane were zeroed using a spirit level alongside the line follower. The load cells and anemometer were then zeroed and the testing could begin.
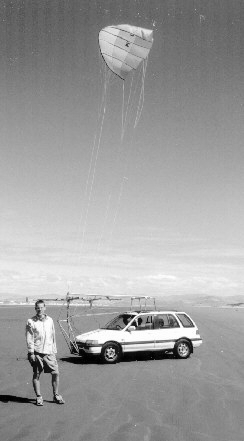
Figure 1.2 Photo of the first test rig.
Problems encountered:
1) As a result of the pivoting action of the rig, if the kite pulled to one side, then the rig would follow. Unfortunately by moving, the rig imparted a force on the kite that enticed it over the other side, starting a nasty resonance between the kite and rig.
2) Once driven to the test site, the rig took around 30minutes to set up. Due to the fickle nature of wind, tides and the test engineers this significantly cut down the time spent testing.
3) Zeroing of the potentiometers was carried out on site prior to testing. After testing the rig was disassembled therefore if the zeroing later appeared to be erroneous, there was nothing that could be done.
Error Sources
1.4 The New Test Rig
The new test rig is designed to be simple and easy to use while giving accurate, dependable results. It’s design does not incorporate a pivoting arrangement as analysis of wind twist has revealed that testing must be carried out in very light winds in order to give accurate results and in these conditions, the apparent wind is very nearly aligned with the rig’s axis.
Figure 1.3 The New Test Rig
Load cells and potentiometers are mounted permanently to the rig and an arm is cantilevered 3m out the side of the car to hold the anemometer and wind vane. The method of attaching the line guides to the potentiometers and the line guide itself have been redesigned to virtually eliminate slop.
Errors are still present in this rig. Significant errors are listed and quantified below:
Table 1.1 Errors still present in new rig.
|
Angular slop |
0.2degrees |
|
Line droop |
Effect is estimated as described in section 3.3 but accuracy is not greater than 0.5 degrees |
|
Pulley friction |
Up to 700g error in load measurements |
|
Velocity profile of wind |
Anemometer errors can be limited using true wind guidelines explained in section 3.2 |
Chapter 2
- Qualitative Analysis of Kites2.1 Survey Conducted
A survey was sent out to 12 local kitesurfers who had each used a variety of kites. The survey aimed to discover some prevalent opinions about qualities of each kite. It included questions asking the surfer’s opinion on the kite’s upwind ability and power control. It was hoped that these qualities could be correlated back to trends in the data particular for a certain kite. The survey is included in the appendices.
Care should be taken if future surveys are to be undertaken to keep them quick and simple to fill out. While the included survey covered all the aspects hoped for, it should have been simplified to only cover kite styles and not individual sizes.
2.2 Results of Survey
C-Quad
Because of its wide use in Christchurch over the last season, this kite ended up forming the benchmark for all other kites to be compared with. Most people felt that the 4.2 or the 6.3 C-Quad were the most comfortable and best upwind.
Waterfoil
The consensus among those who had used the waterfoil was that it had no ability to depower and hence tended to often pull the rider off downwind in gusts. It was also seen as a powerful kite for its size.
Arc
General opinion was that the arc was awesome upwind with the smaller sizes performing better in this respect. Some thought that the arcs depower was better than the C-Quads while others disagreed.
Naish
The most notable feature of the Naish is its ability to depower by letting out the brake lines. Those who are experienced in using it rate its upwind ability above all others.
Chapter 3
- Theory3.1 Theory of Kite Traction, LTD and Power Control
Lift to Drag ratio (LTD) is defined as the ratio of the lift minus weight to the drag of the kite. Using simple vector geometry, this equates to the tangent of qk as below. The angle between vertical and the line angle (ql) represents how close the kite’s pull is to perpendicular to the wind.
Figure 3.1 Description of angles and forces referred to.
In kite traction both the kite and the board/buggy have their respective LTD’s. By adding their loss angles (ql), the LTD of the kite/board system can be obtained. This LTD represents how close to the wind a particular kite/board system can be sailed. For further reading see "Kites and Lift to Drag ratios" (Lynn, 1985)
For example:
Using a kite with LTD = 5 and a board with LTD=3 the respective loss angles are 11.4degrees and 18.4 degrees. Therefore the highest that equipment is capable of pointing is 60degrees into the apparent wind. This represents a system LTD of 1.73
Obviously the LTD of the lines and of the kiteflyer has an effect also and must be included in a through analysis.
LTD also limits aspects of speed sailing. As all pointing equations are relative to the apparent wind, as the board’s speed relative to the true wind increases, the apparent wind shifts forwards and the board is effectively sailing upwind! So LTD also determines the speed a board can travel relative to the wind at a given course angle. More detailed reading as to the limitations on high-speed sailing can be found in Marchaj. (Marchaj, 1979)
Above is classic sailing theory and assumes that LTD is the only variable. For kitesurfing and buggying, if the total line tension from the kite exceeds what the board or buggy can resist then the rider is hauled off downwind. Any excessive line tension may make the board bog down into the water and become less efficient. When sailing at many times the speed of the real wind, apparent wind may vary by several hundred percent. In buggying, riders tend to start off with only moderate power in their kite knowing that due to higher apparent wind, they will have plenty of power available. In kitesurfing it is essential to have at least 20kg of line tension just to water start and so as the apparent wind increases due to board speed, so does the line tension and the rider is at risk of getting ‘overpowered’.
For example: A kitesurfer is reaching at 25knots in 15knots of wind. Before starting off he had 20kg of tension in his lines.
Initial apparent wind = 15knots
Sailing apparent wind = 29 knots
Increase in line tension = (29/15)2 = 380%
So when reaching the rider is left controlling 76kg of line tension!
Power control for a kite is the amount the kite’s pressure coefficient can be reduced from its maximum in a given apparent wind. This is normally achieved by reducing the kite’s angle of attack, or by reducing its plan area by automatic reefing.
3.2 Influence of true wind on accuracy
Every one knows that the wind blows harder at the top of a flagpole than at the bottom. The relationship between these two wind strengths can be approximated using a 1/7th power law velocity profile. The apparent wind that the kite rig and the kite feel are a combination of natural wind and wind induced by the car’s movement. Due to the 1/7th law profile we are left with a twisted flow both in velocity and in direction.
Directional Twist
In the first test rig, the whole top half of the test rig was allowed to swivel in order to align with the wind direction at the kite. Unfortunately this lead to problems as outlined in chapter 1. Doing away with the swivelling rig and bringing the line terminations close together eliminated oscillation problems as well as allowing the lines to twist to the flow without significant angle or force errors.
Velocity Profile
Measurements of apparent wind are taken at the rig height (1.5m), while the required wind velocity is that at the kite (26.5m). By assuming a 1/7th power law profile for the True wind component of the apparent wind, it is possible to determine the scale of error introduced by this height difference.
Apparent wind at rig level (Vi) is the vector sum of car velocity (Vc) and true wind velocity at rig level (Vt1.5). This true wind is incident to the rig at an angle (a) to its direction of travel, ie 0deg = headwind, 90deg = crosswind.
Apparent wind at kite level (Vk) is the vector sum of car velocity (Vc) and true wind velocity at kite level (Vt26.5). This true wind is incident to the rig at the same angle as at the rig. Vw26.5 is calculated using the formula below:
![]()
Knowing Vi and Vk as a function of Vc, Vt1.5 and a, a maximum error in measurement of 5% was used to determine the allowable true wind as a function of car speed. The result of this is shown below as a polar of allowable true wind/car speed vs. true wind direction. For example if the true wind 3km/h at 0deg to the rig, the car speed must exceed 27 km/h before this measurement error is reduced below 5%.
Figure 3.2 Allowable natural wind as a percentage of car velocity and angle
The curious situation where the allowable natural wind increases dramatically has been investigated. Increasing height results in an increase in true wind speed and an increase in apparent wind angle. This increase in apparent wind angle reduces the apparent wind, therefore offsetting the increased true wind speed.
This error in measuring wind speed manifests itself as an error in pressure coefficients. As will be seen later, although the wind speed measurement may be accurate to within 10% at a given time, the coefficients, which are based on V2 are only accurate to around 20%.
For example: if an 8.5m C-Quad is to be tested, its usable wind range is say 15-30km/h. If a 10% maximum error is required, then the error in wind speed must be less than 5%. From figure.3.2 we find that true wind speed must be less than 10% of the car velocity therefore less than 1.5km/h!
Suggestions as to rectifying this problem by using a raised anemometer are presented later in this report.
3.3 Predicting Line Droop
Kite flying lines sag due to the action of aerodynamic drag, mass and (negative) aerodynamic lift. Analysing this line as a chain of short rigid members it is possible to predict the magnitude of this sag.
Figure 3.3 Free body diagram of a section of kite line
Using D = 1/2 CD rAv2 where CD =1.0 (for a long smooth cylinder at Re=1000) (Massey,1989)
And L = 1/2 CL rAv2 where CL is calculated using CL = CDsina2cos(a)
(Hoerner, 1965)
The above theory was written into a spreadsheet. In order to confirm this theory, a test was conducted using the 3.2 C-Quad on 25m lines and then on 40m lines. By removing the respective amount of line drag from both these tests the data for the kite was compared. This confirmed that this method of estimating line drag was accurate to better than 10%
Applying this theory to typical data from the kite rig yielded some intuitively obvious results. Smaller kites showed greater line drag penalties due to higher wind speeds for a given line tension. Approximate line droop angles for kites being used at useful wind speeds (ie. Tension = 10-100kg) and useful brake line tensions (5 – 20% of total tension) are given in the following table.
Table 3.1 Line droop angles under typical tension and wind speeds.
|
Front line droop (degrees) |
Back line droop (degrees) |
||
|
C-Quad |
3.2 |
0.75 – 1.9 |
2.8 - 20 |
|
4.2 |
0.6 - 0.9 |
2.5 - 20 |
|
|
6.3 |
0.3 - 0.4 |
2.2 - 20 |
|
|
8.5 |
0.12 - 0.26 |
1.0 - 20 |
|
|
Arc |
4.4 |
1 - 1.35 |
6.0 - 20 |
|
6.6 |
0.7 – 0.9 |
2.5 - 20 |
Note these are using a constant velocity profile along the kite line, as is the case on the test rig.
This line droop information was used to isolate the lift to drag ratio of the kite itself (LTD). To do this, the lift to drag ratio of the kite-line system (LTDg) was determined and a trend line was taken from this. The lift to drag trend line was converted back to an equivalent line angle and the droop angle of a line under equivalent load and wind conditions was subtracted before recalculating as a lift to drag ratio.
For example:
Raw results of a 3.2 C-Quad test show an LTDg of 4.3 across the wind range. At 60km/h the total line tension is found to be 48kg.
Figure 3.4 Calculating the effect of line droop on LTD
Calculating line droop using a representative line with a tension of 12kg in 16.66m/s of wind with no velocity profile, we get 2.6degrees of droop.
An LTDg of 4.3 is equivalent to a line angle of Tan-1(4.3) = 76.9
Adding 2.6 degrees of droop to that angle results in a line angle at the kite of 79.5degrees
Equating to a LTD = 5.4
3.4 Peter Lynn’s Method of measuring LTD
Previous to the invention of the kite test rig, Peter has estimated the LTD of his kites using a sighting instrument similar to those used in astronomical navigation. By sighting up the section of line adjoining the kite bridle, he was able to estimate the kite’s LTD. Multiple measurements were taken at random times to ensure bias was eliminated. From a design point of view it is important to isolate the line lift and drag from the kite lift and drag. This also allows comparison of the test rig results with Peter’s own results using the above methods.
Figure 3.5 Description of kite line angles as described in this chapter.
From this testing and from 30+ years of kiting experience Peter predicted the LTD of the kites tested to be as below:
Table 3.2 Peter Lynn’s estimates of the LTD of various kites
|
C-Quad |
5-6 |
|
Waterfoil |
4-5 |
|
Arc |
6-8 |
|
Naish |
6-8 |
3.5 Reality check employed – flying in circles
While this project focuses on determining the LTD of a kite by measuring the line angle, another method has been used to check whether this method is giving sensible results. Below is the theory outlining this procedure.
A paraglider has a FBD given below:
Figure 3.6 FBD of a paraglider in steady flight
Horizontal equilibrium: Dcosqk = Lsinqk given no horizontal acceleration…(1)
Hence rearranging (1) L/D = cosqk /sinqk
=1/tanqk
Now if a kite is flown in still air by means of the flyer walking backwards as below, it is possible to analyse how far the kite has travelled in the direction of forward flight and how far it has been pulled through the air.
`
Figure 3.7 Flying a kite in still air
By walking backwards, always directly away from the kite, a kite flyer is able to fly the kite in horizontal circles. The FBD for this situation looks like that below.
Figure 3.8 FBD of a kite in steady horizontal flight.
As with the paraglider analysis L/D = 1/tanqk
If flown in zero wind, then 1/tanqk is the ratio of the distance the kite flys forward to the distance the kite is pulled towards the flyer. If flown around in horizontal circles this ratio becomes the ratio of the radius of the circle the kite flys to the radius of the circle the flyer walks in.
This LTDg then needs the lift and drag of the flying lines removed from it. The flying lines are influenced by a linear velocity profile along their length.
Chapter - 4
Testing procedures4.1 Calibration of Instruments
Both the anemometer and wind vane were calibrated in the laminar flow wind tunnel. The anemometer was held in a test tube stand and connected to the PC (Figure 4.1) while the wind speed was increased from 0 to 100km/h. From this a calibration factor was determined and used in the data acquisition program.
The wind vane was tested on a static rig to determine if it read angles accurately and was also tested in the wind tunnel to determine its stability and range of readings. This variation was deemed acceptable at 0.2degrees.
Figure 4.1 Calibrating instruments in the wind tunnel.
The potentiometers were calibrated while on the rig using a backing board with pins that located the line guides at 0,30,60 and 90 degrees (figure 4.2). From this a calibration coefficient for each potentiometer was determined and used in the data acquisition program. The potentiometers were linear to within 0.3 degrees.
Figure 4.2 Calibration of the Potentiometers using a backing board.
4.2 Methods for Zeroing the Potentiometers
Zeroing the potentiometers
Originally the potentiometers were zeroed before each test using a spirit level at the beach. A new method is to zero the potentiometers by parking the car under the gantry crane outside the Civil Engineering building. Attach a line similar to a washing line above the car and then throw the kite line over top. By attaching a weight to the loose end of the kite line, it will hang vertically and one can slide the kite line along until the line upwards runs parallel to the line to the weight.
-advantages of new method
Using a plumb bob attached to the control line zeros the potentiometer relative to the line, not the line guide. It is repeatable to within +0.1degrees and can be checked before and after going out testing to see if anything has changed. A final advantage is that this method calibrates the potentiometer to the vertical while most measurements are taken around 78degrees, therefore any non-linearity in the potentiometer output is minimised.
One of the major problems encountered in the results was the inexplicable loss of calibration of the potentiometers. This may be picked up and rectified during zeroing before testing or may show up in results. Results where the two front kite lines are reading consistently different angles are obviously erroneous.
To solve this, the rig was zeroed after each trial and the data modified appropriately. If the data was still different as would happen if the calibration changed during a trial then the data was thrown out.
4.3 Kite Testing
Step by step methods used in testing the kites is outlined in Appendix A
Once the tests were completed and the data analysed trends of LTD, CL and CD as a function of wind speed and of brake line pressure were able to be graphed. Compilations of these plots are presented and commented on in the next chapter.
Chapter 5 -
Results and Discussion5.1 Kite Lift to Drag Ratios
5.1.1 LTD repeatability
From the five trials of a 3.2m C-Quad presented in Figure 5.1, it can be said that the data is repeatable to within +10% of a mean value. This +10% value equates to +1 degree of azimuth angle.
The LTD trend is found to be very repeatable. The negative correlation between LTD and brake line pressure was of very similar magnitude in all tests on the 3.2 C-Quad.
Figure 5.1 LTD vs. Brake line load used to confirm the rig’s repeatability
5.1.2 LTD trend with varying wind speed
LTD of the kites tested sometimes increased and sometimes decreased with increasing wind speed. It was not repeatable in this respect. It is noted that at low wind speeds the mass of the kite plays a significant role and the LTD often drops off. In this wind range the angle is of little relevance and the data is eliminated from all analysis.
5.1.3 L/D trend with varying brake line %
A number of test runs were done on each kite varying the amount of brake line pressure. LTD vs. Brake line pressure plots for various kites are presented in Figure 15. This brake line pressure is measured as a percentage of the total line tension and is likely to affect the angle of attack of the kite.
A strong trend was found between increased brake line pressure and decreasing LTD in all C-Quads and the Waterfoil tested. Meanwhile the 2 models of Arc tested showed increasing LTD with increasing brake line pressure. The Naish appeared to peak with significant brake line.
It is noted that the C-Quads and the Waterfoils have their brake line attached to the very trailing edge of the kite and especially in the case of the Waterfoil, applying brake distorts the kite’s profile. On the Arc and the Naish the brake lines don’t cause distortion but apply a distributed load that tends to pull the back of the kite down therefore probably increasing angle of attack.
Both the Naish and the Arc would have decreased LTD at excessively high brake line tensions and the way in which this drops off should be studied.
Airfoil theory suggests LTD vs. a charts like Figure 5.2 It is suggested that the C-Quads may be operating in the decreasing portion of the graph while the arcs are in the increasing portion and the Naish is straddling the peak. This theory is built upon in the section following titled ‘Magnitude of CL and its influence on LTD’
Figure 5.2 Typical LTD vs. angle of attack data
5.1.4 LTD for various kites
Plotting LTD for the kites tested reveals standout performance from the 4.4m Arc and the 4.2m C-Quad. The water foil recorded the lowest LTD of the lot, varying from 4.7 to 3.2 as brake line was applied. The C-Quads showed very similar trends over the size range varying from LTD=5.2 with slack brake lines to around 4 prior to stall. This result is consistent with Peter Lynn’s hypothesis that all sizes of a style of kite will have similar LTD. the 4.2m C-Quad and the 4.4 Arc were the exceptions, recording high LTD’s and should be retested to check if errors were present.
Figure 5.3 Experimental results of LTD vs. Brake line Load %
5.1.5
LTD determined by alternate methodThe standard 3.2m C-Quad was tested on a no wind day at the beach in the method described earlier. By dragging one foot in the sand, the radius of the flyer’s circle could easily be measured.
Flying on 15m lines the kite was flown in horizontal circles taking around 8seconds per revolution.
Table 5.1 Results of reality check testing.
|
Trial 1 |
Trial 2 |
Trial 3 |
|
|
Min. flyer circle diameter (m) |
6.3 |
6.6 |
6.1 |
|
Max. flyer circle diameter (m) |
8 |
8.3 |
7.3 |
|
Avg. flyer circle diameter (m) |
7.15 |
7.45 |
6.7 |
|
Length of lines + bridles (m) |
17 |
17 |
17 |
|
LTDg |
4.76 |
4.56 |
5.07 |
|
Angle of Line Droop (degrees) |
0.36 |
0.36 |
0.36 |
|
LTD |
4.91 |
4.7 |
5.25 |
Mean LTD = 4.95
The LTD with minimal brake line tension for the 3.2 C-Quad in 6 different trials is shown below for comparison.
Table 5.2 Summary of test rig LTD results with 5% brake line load
|
Trial 22-7 |
Trial 1 29-7 |
Trial 2 29-7 |
Trial 13-8 |
Trial 1 16-8 |
Trial 2 16-8 |
|
|
LTD |
5.38 |
5.28 |
5.21 |
5.89 |
5.02 |
5.03 |
Mean test rig LTD = 5.30
5.2 Kite Lift Coefficients
5.2.1 Lift Coefficient repeatability
All lift coefficients quoted in this report are based on nominal kite surface areas. The lift coefficients based on projected areas should be easily calculated if the ratio of Nominal Area/Projected Area is known.
As with the LTD data, the trends in CL as a function of % brake line load are strongly repeatable while the actual values still vary from day to day. By taking average values and considering the spread from those averages it can be said that this method is repeatable to within + 11% in the case of this kite.
 Figure 5.4 Lift coefficient as a function of % brake line load for 3.2 C-Quad.
It is interesting to note that the trend line with the highest lift coefficient was recorded on the 22-7-00, the same trial that recorded the highest LTD measurements. The same is true for the 2nd highest trend line.
These two results suggest that the results may be being affected by an environmental factor such as temperature, humidity or power supply voltage. It is accepted that excess wind could inflate lift coefficient data but would have the reverse effect on LTD as the windage on the lines would be more than that allowed for.
5.2.2 Change in CL with wind speed
The CL values above are taken as averages at wind speeds sufficiently high to negate the effect of natural wind on the results (see chapter 3.2). In tests on most kites the lift coefficients are seen to decrease across the lower part of the wind range used. This indicates that the natural wind is having a significant effect and hence results must be treated with extra caution. In the case of the 8.5, 6.3 and 4.2 C-Quad the data was influenced too strongly by natural wind and therefore discarded.
As mentioned above, the variations with wind speed are thought to be dominated by V2 effects of natural wind. Below a plot of CL and CD as a function of wind speed is presented. This test was run on the 29-7-00 with a 3-6km/h cross-onshore breeze blowing.
From prior analysis (section 3., the coefficients should be accurate to within 20% when the true wind velocity is below 10% of the car velocity. i.e. the data should only be used above 50km/h.
This theory is confirmed by the horizontal nature of the plot above 50km/h below.
Figure 5.5 Pressure coefficients vs. Wind speed for 3.2 C-Quad
5.2.3 Changes in CL with brake line %
 Figure 5.6 Lift coefficient vs. Brake line percentage for various kites.
The most useful data that is gleamed from this analysis is the ratio of maximum to minimum lift coefficient. This equates to the percentage of line tension that can be depowered in a given wind strength.
It is noted here that the Naish was not tested at lower brake line percentages due to unfamiliarity with the kite and therefore fear of luffing.
Table 5.3 Max. and Min CL for various kites
|
3.2 C-Quad |
3.6 Waterfoil |
4.4 Arc |
6.6 Arc |
11.5 Naish |
|
|
Min. CL |
0.8 |
1.3 |
0.5 |
0.45 |
0.5 |
|
Max CL |
1.3 |
1.7 |
0.8 |
0.75 |
0.9 |
|
Depower Ratio |
1.6 |
1.3 |
1.6 |
1.7 |
1.8 |
These result correlate with what riders said in the survey about the waterfoil having very limited power control and support the claim that the Naish is superior to the C-quad in this respect. It should be noted that although the Arc and the Naish appear to have only slightly more depower than the C-Quads, they maintain or improve their LTD at the same time as increasing their lift coefficient. In the case of the C-Quad and the Waterfoil, LTD decreases significantly as lift coefficient is increased. This is to say that while the C-Quad and the Waterfoil are capable of ultra high lift coefficients, these cannot be utilised in upwind or high speed sailing because they are delivered at such low angles.
5.2.4 Magnitude of CL and its influence on LTD
It is seen from Figure 5.6 that the Arc and the Naish possess low lift coefficients compared to kites such as the C-Quads and Waterfoil. Interestingly both the Arc and the Naish are considered superior kites in most aspects of kitesurfing.
The coefficient of lift determines induced drag and therefore should be able to estimate LTD. Some work has been done by Rob Lynn on this subject, resulting in theoretical plots of lift coefficient vs. LTD for a given kite style and given aspect ratio. The aspect ratio and profile drag factors have been modified until the theory is similar to the experimental data. Below are these plots for C-Quad, Arc and Naish each with experimental data superimposed.
C-Quads. Theoretical trends supplied by Rob Lynn.
It is important to note the limitations to the graphs presented here. They have been presented simply to help confirm the earlier stated theory that the C-Quad operates at lift coefficients above the LTD peak while the Arc and Naish are near or below the peak.
 Figure 5.8 Theoretical and experimental plots of LTDg as a function of CL for
Arcs. Theoretical trends supplied by Rob Lynn.
Naish AR5. Theoretical trends supplied by Rob Lynn.
5.3 The windvane
A windvane was mounted 3m out the side of the car and allowed to rotate in order to determine any vertical component of apparent wind. This was intended to provide a stream wise datum from which to measure the kite’s line angle.
Through measuring the wind angle during each of the tests, results using and discarding the wind angle have been calculated. It was found that if the wind angle was included in the calculations, either as instantaneous values or as an average value, the results were scattered by up to 4 degrees while discarding the wind angle resulted in repeatable results within 1 degree as shown below.
It is thought that the variation in wind angle is due to twisting of the wind vane and flexibility of the rig holding it in place. It is suggested that the windvane be discarded and the spare channel be used to monitor the other back line angle measurement. In discarding the windvane, the anemometer could be mounted on a vertical pole near the front of the car. This would lessen the errors associated with wind measurement errors due to true wind.
5.4 Kite Launch Results
As power kites launch they are capable of huge line tensions. These tensions are the result of the wind speed created by the kite’s movement. Launching small kites behind the test rig is able to be done with the new rig and may prove useful as a comparison with theoretical calculations of kite dynamics.
Below the launching of a 3.2 C-Quad shows a tension spike of 60kg in only 18km/h of wind. The wind is partly due to accelerating forward and is therefore increasing slightly throughout the trial.
 Figure 5.10 Experimental 3.2 C-Quad Launch data.
5.5 Minimum and Maximum Line Tension Needed For Kitesurfing
By asking a number of kitesurfers how much wind they felt they needed to get planing with a given kite, it was possible to approximate how much line tension it takes to make a kitesurfer plane. A similar approach determined how much line tension a kitesurfer can handle before being overpowered.
Table 5.4 Line tensions used during kitesurfing.
|
Kitesurfer weight |
Line tension to be planing (kg) |
Line tension to be overpowered on a kiteboard (kg) |
Line tension to be overpowered on a wakeboard (kg) |
|
60 - 80kg |
20-25 |
50 |
60 |
These values are approximate and are assuming the kitesurfer is sailing slowly compared to the true wind when overpowered.
Chapter 6 -
Conclusions
6.1 Conclusion
The rig has been shown to give repeatable results of LTD to within 1 degree and repeatable results for lift coefficients to within 11%. Higher accuracy could and should be gained by statistically analysing a number of trials. The error in LTD could easily be reduced to below 0.5 degrees. Major errors are thought to be due to angular slop in instrumentation
At the same time testing kites using the alternate method of flying in circles appears to allow for accuracy in LTD of similar magnitudes. If LTD at low brake line pressures is all that is needed then the flying in circles method is ideal.
The rig comes into its own when analysing trends in data with varying wind speed or brake line pressure. It also allows for quantitative results of lift coefficients. If further work is to be done on comparing theoretical analysis of LTD as a function of CL with real kites then the test rig will remain essential.
The rig has been found to be influenced by even the slightest true wind and as such the CL of some of the kites was not able to be determined. It is suggested that the anemometer be attached high above the rig to reduce this effect.
Results from the survey suggest that both the Arc and the Naish are far superior upwind and while the LTD data confirms that they are better, the difference seems small.
Significant though, is the fact that even near their maximum lift coefficients, both these kites exhibit high LTD’s, while the C-Quad and Waterfoil both have decreasing LTD’s as CL increases.
Comparison of theoretical and experimental LTD vs. CL suggest that while the Arcs and Naish are operating below or at their optimal CL for their aspect ratio, the C-Quads are operating above their optimal and hence in the decreasing region of Figure 5.2
6.2
Future Direction of Project-Add flats to potentiometer shafts and grub screws to clevises to make angular location 100% positive.
-Discard windvane arm and mount anemometer on vertical pole at front of car. A significantly long pole will lessen the effect of natural wind on coefficient accuracy (see chapter 3.2).
-Move line attachment points together to minimise any error caused by wind twist.
-Ensure that time is spent on calibration check after each day of testing and also on careful post processing of data.
-Due to the controllable nature of testing kites behind a car, it provides the perfect method of viewing buckling failure of kites. On certain types of semi rigid kites such as the C-Quad, compressive stresses build in the spars with increasing line load. The Arcs can suffer from bending stresses in the end spars. By taking photos of the kite at various wind speeds, the distortion of the kite can be seen and compared to the line tension. Obviously alarm bells will be ringing if significant distortion occurs in the range of line tensions in which the kite is to be used.
Fig.6.1 Buckling of the leading edge spar on a 6.3 C-Quad at 60kg total line tension caused by tight check bridles.
-If the angle of attack of the kite could be determined then LTD, CL and CD could be plotted against a. This data could then be compared to readily available data for yacht sails, wings etc. A method of determining a would is to note the relative length of the front and back lines to the kite and allow for line droop. This may work as a method on its own or may function as a reality check of another more sophisticated method.
Another method of measuring a may be to fly the kite in natural wind and take photos of the kite. A streamer attached to the kite flyline may be able to be used as a horizontal datum. The cameraman would need to stand a long way away with a good zoom in order to reduce perspective errors.
-Addition of a block and tackle arrangement to allow for significant brake line loads to be applied while still allowing a range of back line lengths.
References
1) Hobbs, S.E. "A Quantitative Study of Kite Performance in Natural Wind with Application to Kite Anemometry". PhD Theses, Cranfield Institute of Technology. 1986
2) Hobbs, S.E. "Kite Measurements in the Boundary Layer". Wind Engineering. Vol 13 No 2 pp 50-60. 1989
3) Lynn, P. "Kites and Lift to Drag Ratios" 1985
4) Marchaj, C.A., "Aero-Hydrodynamics of Sailing", Granada Publishing Ltd, London 1979.
5) Massey, B.S. "Mechanics of Fluids", Chapman and Hall, London 1989
6) Horner, Dr Ing.S.F. "Fluid Dynamic Drag" 1965
7) Jackson, S.B. "Free flight tests on kites in the 24ft windtunnel" 1942. Communicated by the Principal Director of Scientific Research (Air) Ministry of Supply.
Appendices
Appendix A - Using the test rig
This section is written to pass on knowledge of things to do and not to do when testing. It is not definitive and is not necessarily the best way to test the kites but it serves as a good starting point and is the method used by the author.
The night before:
On the day:
After testing:
Notes on testing:
Appendix B - Post processing of Data
Once a set of trials has been completed it is up to the analyst to ensure that the data is used wisely. Below is a list of recommended steps to take in analysing the data.
1) Import data into excel and graph as a function of time.
It is important for the analyst to notice any discrepancies such as two line angle measurements being different when they are measuring the same thing or a load cell not returning to zero when the kite is not flying. If these are found before going testing again they can sometimes be quantified and eliminated.
It is also necessary to make a judgement call as to when the kite is flying steadily. Often at low wind speeds the kite flys at low angles due to self weight.
Formulae used:
Brake line load % = Brake line load/Total line load*100
CL = (Front line load * Sin (Front line angle) + Brake line load * Sin (Brake line angle))*g / (0.5*r*A*windspeed2)
where wind speed is measured in ms-1 and A is the nominal surface area of the kite.
CD = (Front line load * Cos (Front line angle) + Brake line load * Cos (Brake line angle))*g / (0.5*
r*A*windspeed2)Appendix C - Kite Survey
Andy here. I'm doing some work for Peter Lynn on quantifying the performance of traction kites. To add to this work and to bring in the human factor I'm sending out this survey. What I aim to do is begin to figure out what it is that makes certain kites feel the way they do, you know, the sort of stuff we all do a lot of arm waving about after a session on the water. By comparing kite data and sailor comments I think
some things will become obvious.
It should only take you a few minutes and will help in my university project immensely. If you don't know what to put or if you haven't used a particular kite that's cool, I'd prefer you to leave it out than run on hearsay.
Thanks for your time and I'll keep you all posted on the results.
Questions 1-4. Please answer using:
a=always, o=often,s=sometimes, f=seldom, n=never
Q1) - how often do you feel that you need more power through the lulls?
Q2) - how often do you feel you just can't depower enough through the gusts?
Q3) - when overpowered and getting dragged off downwind how often are you able to haul upwind again without stopping?
Q4) - when overpowered how often are you able to maintain a reasonable reaching speed without getting accelerated downwind?
(Q1) (Q2) (Q3) (Q4)
Straight spine C-quad 4.2
6.3
8.5
Bent spine C-quad 4.2
6.3
Waterfoil 3.3
5.7
Arc 3.2
4.4
7.0
Wipika 5.0
7.0
Naish 5.0 AR3.5
11.0 AR5.5
Questions 5-9. Please answer the questions below ranking only the kites
you have used, 1 being the best etc.
Q5) - How do you rank the upwind performance of these kites?
Q6) - Please place these kites in ranked order as you perceive them, for freestyle
Q7) - Please place these kites in ranked order as you perceive them, for racing
Q8) - On average can you rank these kites by the height of jumps you can get.
(Q5) (Q6) (Q7) (Q8)
Straight spine C-quad 4.2
6.3
8.5
Bent spine C-quad 4.2
6.3
Waterfoil 3.3
5.7
Arc 3.2
4.4
7.0
Wipika 5.0
7.0
Naish 5.0 AR3.5
11.0 AR5.5
Q10) -With which of the following kites are you able to ride your board
flat (using the fins and not the rail )? Please delete those that don't
apply.
Straight spine C-quad 4.2
6.3
8.5
Bent spine C-quad 4.2
6.3
Waterfoil 3.3
5.7
Arc 4.4
7.0
Wipika 5.0
7.0
Naish 5.0 AR3.5
11.0 AR5.5
 Appendix D - Project Gaant Charts
Appendix E - Costing
Table C.1 Costing information
|
Description |
Cost |
Total |
|
Materials for rig rebuild |
$200 |
|
|
Labour for rig rebuild |
$200 |
|
|
Car Certification |
$500 |
|
|
Car running costs |
$10/hr |
$200 |
|
Blown head gasket |
$350 |
|
|
Wind tunnel |
$50/hr |
$150 |
|
EDM Wirecut |
$100/hr |
$50 |
|
Printing costs |
$50 |
|
Total Cost $1700